Clicking “Done” on PARCC Tests
State education officials announced in June that Colorado will stop administering the PARCC exams, standardized tests that are used in multiple states to assess student and school achievement of Common Core standards in math and language arts.
The PARCC exams, which have been used in grades 3–8, were designed to allow cross-state comparisons and provide year-over-year achievement and growth data. They have been under fire, however, because of the number of hours of testing required; many schools dedicated several weeks or more to testing. The results from PARCC tests also came out much later than anticipated, making them less useful than desired by school administrators.
The state will instead adopt a shorter test to assess Colorado Measures of Academic Success (CMAS) that is designed by Pearson, the company that also developed the PARCC test. The new test will last no more than eight hours and will be directed by Colorado educators. The turnaround of results will be faster, according to the Colorado Department of Education (CDE). The CDE also says that the new CMAS test results will be comparable to prior years, allowing them to hold schools accountable for student achievement and growth.
This year, PARCC questions will still be used in slightly shortened exams, however, with a goal of full transition by 2018.
![]()

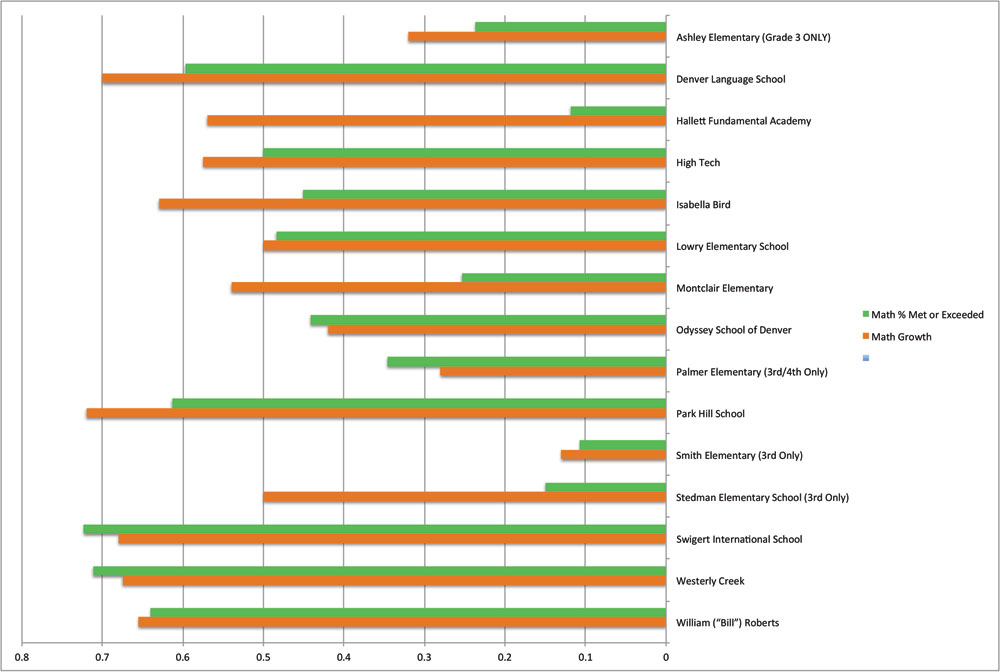
Elementary Math

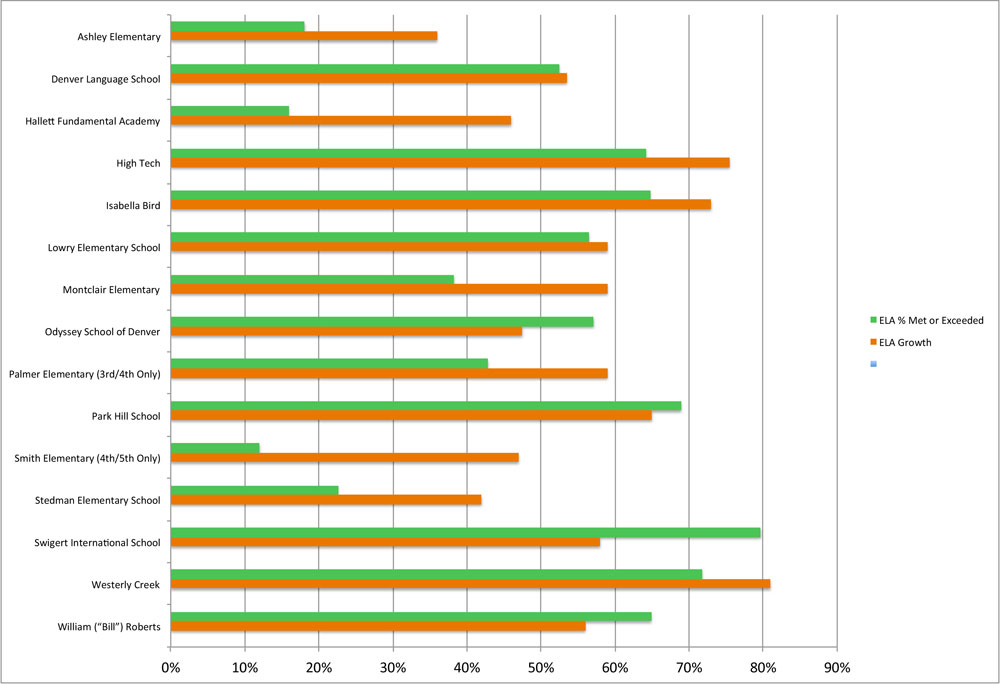
Elementary English/Language Arts

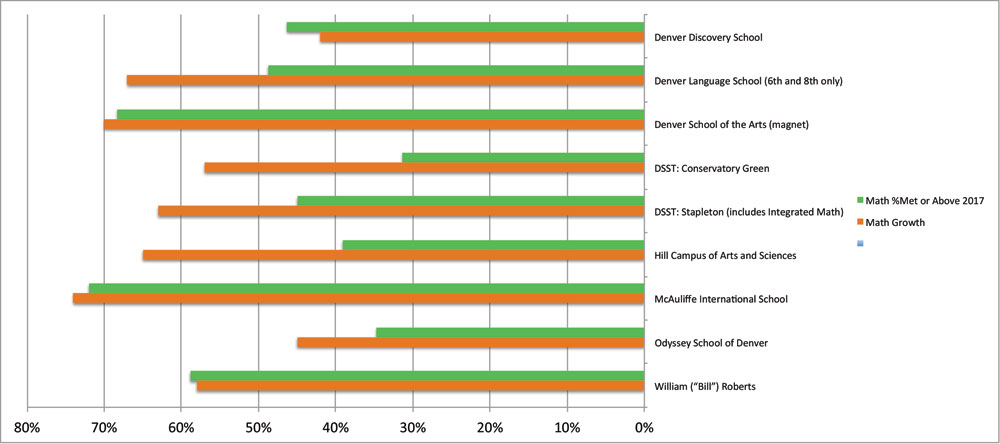
Middle School Math

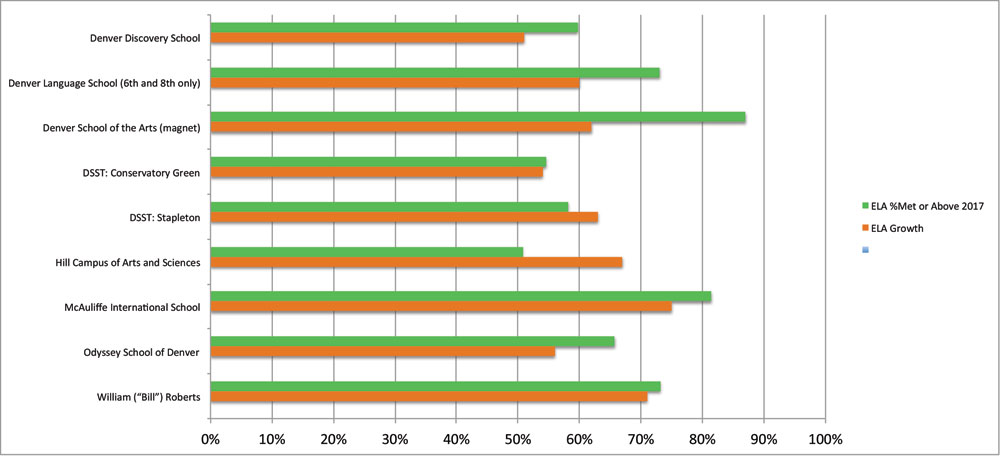
Middle School English / Language Arts
Understanding PARCC Results
In August, scores were released for the PARCC exams (Partnership for Assessment of Readiness for College and Careers) in English Language Arts (ELA) and Math. The exams assess student proficiency in meeting grade-level standards set by the state. They are aligned to the Common Core national standards. This is the third year for this test in Colorado.
Percent Proficient represents the percentage of students who meet or exceed state proficiency standards in the content area.
Growth is the Median Growth Percentile (MGP). Fifty percent represents one year’s growth. It is calculated by ordering individual student growth percentiles from lowest to highest and identifying a middle score, which is the median. A median score below 50 percent indicates more than half the students have not achieved a year’s growth. A median score above 50 percent indicates more than half the students have achieved a year’s growth.
*For better readability, please click here: Pages 24-25 09SEP17_REV
Sources: Colorado Dept of Education; Chalkbeat.org; A+ Colorado.


0 Comments