


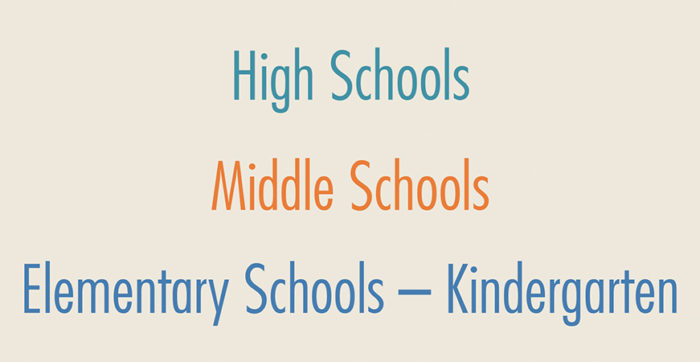
High Schools
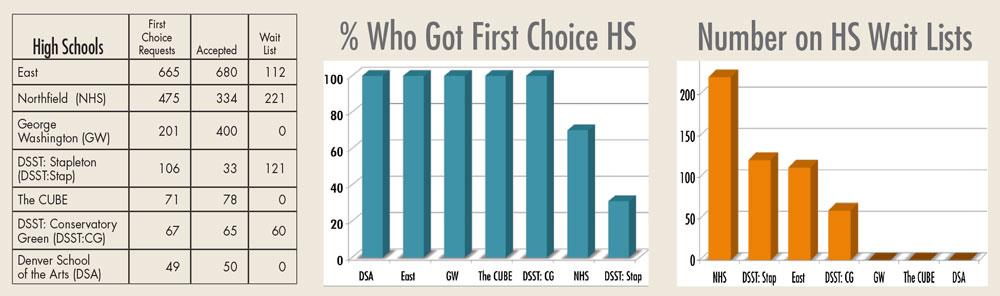
If the total number accepted is greater than the number of first choice requests for a given school, then 100% got their first choice. The chart below at left illustrates the percent of students who got their first choice at each of the high schools.
But if, for example, a student got their third choice, their name would be placed on the waiting lists for both their first and second choice schools. The chart directly below shows the number of students on each high school’s wait list.
Northfield High School differs from traditional boundary schools in that it’s a boundary school for Stapleton and a portion of Park Hill, but, in addition, it has a mandate for 35% of the school’s population to be composed of Far Northeast students.
Middle Schools
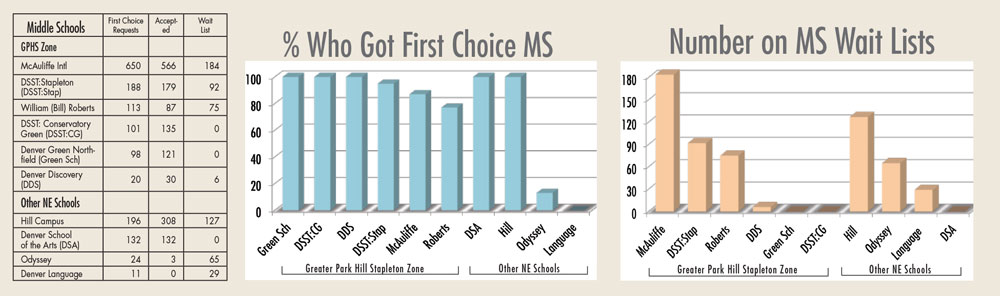
If the total number accepted is greater than the number of first choice requests for a given school, then 100% got their first choice. The chart above illustrates the percent of students who got their first choice at each of the middle schools.
But if, for example, a student got their third choice, their name would be placed on the waiting lists for both their first and second choice schools. The above right chart shows the number of students on each middle school’s wait list.
All numbers here are based on the outome of first round choice. Changes are likely during second round choice.
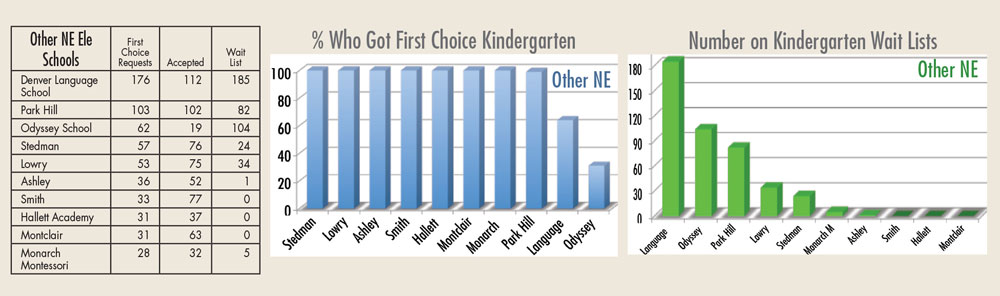
Elementary Schools – Kindergarten
Stapleton Elementary Schools (Graphs below are explained with the Middle and High School sections.)
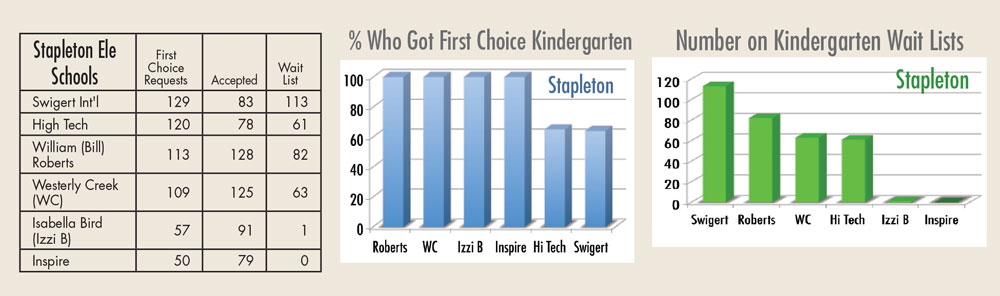
Other NE Elementary Schools (Graphs below are explained with the Middle and High School sections.)

I am still confused about these charts. My child lives in the DPS district, put East as her first choice, and went from #9 on the waitlist to 53rd. If 100% got their first choice, how did she end up on the waitlist?
I believe our explanation should have said, 100% “within the boundary” got their first choice. We’ll check with DPS to get a little more detail on what happens with those wait lists.
I’m a little confused about the charts. It looks like most schools had 100% of those who listed it first get in. But, most of them also have wait lists. For example, Stedman is listed as 100% of kids who listed it first getting in, but 30 on the wait list. So, does that mean that every single person who was wait listed listed Stedman as #2 or less?
In the Stedman example, 57 chose it first and 76 were placed, indicating all who requested it first got in — and 19 more were placed there. The database of first round choice results did show 24 waitlisted (not 30). Given all the local schools in our charts that show 100% got first choice, the wait list numbers look high for being composed only of people who who gave it a higher ranking than where they got in. I would guess those numbers are coming from students elsewhere in DPS or outside DPS but someone from the District would have to give the final answer on that.
Duh, gotcha, I was looking at the Lowry chart and confused it with Stedman. However, I’m not sure that you really can conclude that cases where more students were admitted than listed it first means that all students who listed it first got in. Stedman in particular is a different case because students could have listed Stedman on the choice form twice. The Stedman Spanish program is a different choice than the Stedman traditional classroom and has been more popular. Same issue with DLS (Spanish and Mandarin…Spanish is more popular) and Monarch also now has two tracks. So, a kid’s first choice could have been Spanish, they could have gotten in to regular as their 2nd, 3rd etc. choice and they’ll show as accepted, but they didn’t get their first choice.
I wonder if there also could be other situations that could result in a school having fewer first choice accepts than you might be able to see just from looking at accepted vs first choice. For example, it looks like 99% of kids who listed Park Hill as a first choice got in. But, what if 20 of those accepted at Park Hill live in the Park Hill boundary and listed DLS, Bill Roberts or Odyssey first and PHE second and got waitlisted at those first choices and admitted to PHE? And, an additional 20 kids listed PHE first from somewhere else in Park Hill (which is common)? That would make the percentage of first choice accepts closer to 80%. Of course, I totally made that up off the top of my head, so it’s not based on fact.
Thanks for answering me! I’m probably just over thinking it or misunderstanding. I’ll reach out to the choice office to see. It just kind of threw me because I know people who told me that they listed one of these schools first and didn’t get in, at least not initially.
Our understanding of the basic DPS choice policy is if you live in a zone and request a school as your first choice and the school has room for more than the in-boundary first-choice requests, then you’ll get your first choice. We certainly should have clarified the “in-boundary” part in our explanation to avoid the confusion you identified. There may be exceptions that don’t follow that rule and our charts don’t account for and explain those exceptions. We’ll see if DPS can explain for us the situations that don’t follow the basic choice policy we stated and include that information next month.