


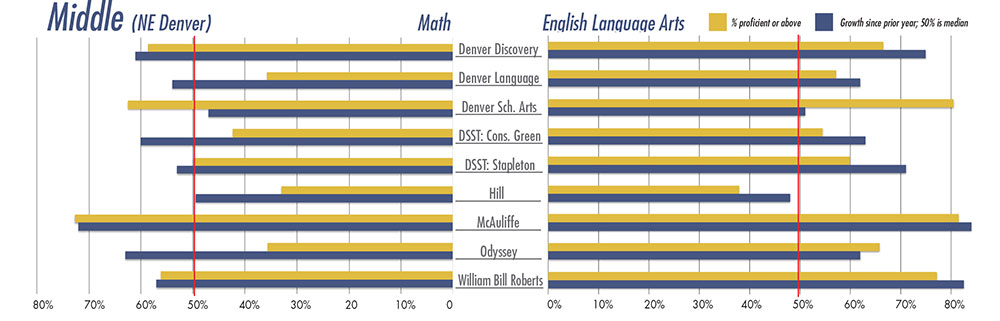
We apologize that growth and proficiency scores were switched on the middle school chart printed in the paper and Bill Roberts English Language Arts growth score was not correct. A revised chart is posted below and can be downloaded here.
Understanding PARCC Results
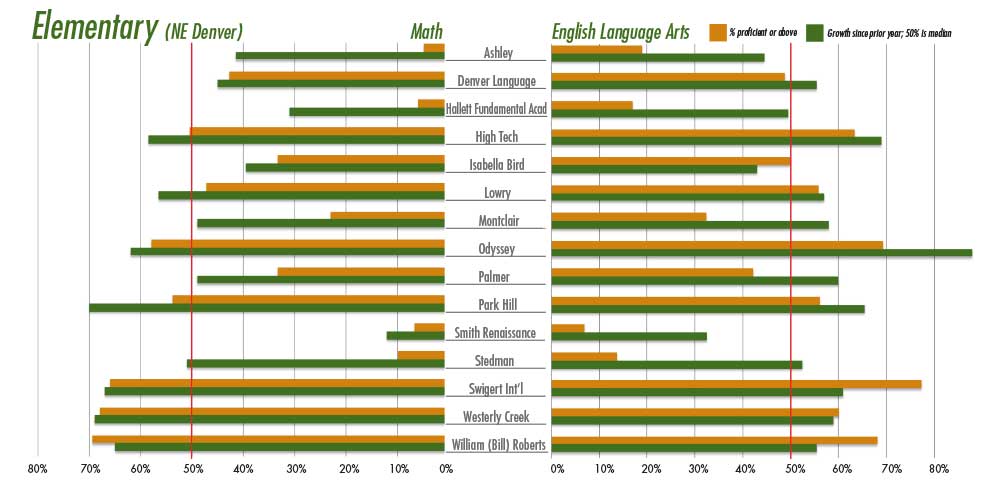
In late September, scores were released for the PARCC exams (Partnership for Assessment of Readiness for College and Careers) in English Language Arts (ELA) and Math. The exams assess student proficiency in meeting grade-level standards set by the state. They are aligned to the Common Core national standards. This is the second year for this test in Colorado, allowing measurement of student growth.
Percent Proficient represents the percentage of students who meet or exceed state proficiency standards in the content area
Growth is the Median Growth Percentile (MGP). Fifty percent represents one year’s growth. It is calculated by ordering individual student growth percentiles from lowest to highest and identifying a middle score, which is the median. A median score below 50 percent indicates more than half the students have not achieved a year’s growth. A median score above percent indicates more than half the students have achieved a year’s growth.
Scores represent averages of grades 3–5 for elementary and grades 6–8 for middle schools.
———————————————-
Although media coverage about standardized tests often focuses on opposition to them, local stakeholders in education express near universal approval of the rigorous Common Core standards that the exams assess. However, administrators, teachers, parents and students do have mixed feelings about length of tests and timing of results. With the recent release of scores, the Front Porch asked these local stakeholders about PARCC (Partnership for Assessment of Readiness for College and Careers) exams.
Delayed Results
One of the frequent criticisms of the PARCC exams has been the slow turnaround time for results. The first year, results for exams taken in April were not available until December. This year it was October.
“One of the reasons PARCC was presented was that the results would come in an incredibly timely fashion because it was computer-generated so those results would actually inform our instruction going into the fall, and, unfortunately, we haven’t had that yet,” says Shelby Dennis, assistant principal at Swigert International School and the site assessment leader for the exams at Swigert. Her school would prefer the data sooner.
Dr. Amy Gile, principal of High Tech Elementary, says, as a young school still adding new kids and teachers every year, “We like our teachers to have some time getting to know the kids before looking at a number,” so getting the results late is not a problem.
Susana Cordova, Denver Public Schools (DPS) deputy superintendent, explains, “Some of the delays have been around needing to set cut-points and the complexities of the test being new, but the goal is for information to be available more quickly.” It remains to be seen if two years of experience with the system in Colorado will result in a quicker turnaround for the spring 2017 tests.
Testing Hours
Although very few local students opt out of the exams, a concern for stakeholders is the amount of time that testing takes. “We take three full literacy tests, each 90 minutes; three full math tests, each 90 minutes; multiple sessions of science and social studies,” says Dennis. She observed that the younger students especially struggled with the typing requirements and long hours, and in a larger school like Swigert, with 336 students to test, the whole system is highly impacted, particularly with makeup and extended sessions that take away from classroom instruction. “Why is it necessary to gauge a student’s proficiency or mastery of the standards in that significant amount of time?”
In a smaller school with ample technology resources like High Tech, which only tested 112 students last year, the burden was manageable. Gile noted, “I think the shift they made last year to shorten the testing time was good. It didn’t feel overwhelming like it had in the past.”
Students complain about the length of the test. Kaya Douglas, a seventh-grader at McAuliffe International School, feels the whole testing period can be “long and stressful” for students. She thinks some students tend to try harder at the beginning of a test session but become fatigued and not care as much by the end.
Brandon Auster, father of a sixth-grader at DSST: Conservatory Green and a fifth-grader at Swigert, says his kids “haven’t really experienced much of the test anxiety due to the culture the school has around the test. We have been pretty lucky the last couple of years.” In terms of the hours of testing, Auster feels it is fairly balanced, “It would be great if it was less time, but in the grand scheme of 150–200 days of school a year, spending a few days to make sure that a school is on track and achieving their goals is valuable.”
Usefulness of results
Despite the delay in results, local educators are able to make use of PARCC to inform their curriculum. Jennifer Snodgrass, teacher and the team lead for language and literature Common Core implementation at McAuliffe, says they use data continuously throughout the year to improve curriculum. So even the late arrival of PARCC scores provides insight.
For example, “When we got our data last year … we saw that our sixth-grade writing scores were lower than seventh- and eighth grade, so we made some changes to curriculum to address that,” Snodgrass said. “The next year, our writing scores went up 21 percent, so it worked. We were very intentional about how we used the scores, and it had impact.” Gile also noted that once the results came, after celebrating successes, she and her team “really honed in on where we saw gaps in our subgroup data.”
Parents and educators use the results not just to assess individual learning but to assess school performance. Auster says it is “helpful as a parent to see results to evaluate the school as a whole, to make sure your child is in a school that is performing well, surrounded by peers that are solid achievers also.” Snodgrass agrees that performance trends shown in test results for schools with larger sample sizes can legitimately reflect student learning.
Getting Rid of PARCC
In October, the State Board of Education discussed the possibility of eliminating the PARCC exams after the expiration of Colorado’s testing contract in 2017, although more recently the board has indicated it would likely continue with the exams for the foreseeable future.
When considering the possibility of the state board moving away from PARCC testing, most local stakeholders preferred to keep it. “There’s some real benefit in consistency for teachers” in keeping the same test, says Gile. “I feel like the data is really valuable. I think it tells us the right things about kids.”
Also, the administration of the exam is improving. Dennis doesn’t think they’ve had a chance to know the strengths of the assessment “because we haven’t had the data a) long enough and b) in time. I would rather have us stick with it so we can see if it is worthwhile. It’s hard to switch.”
Cordova believes what’s most important is to clearly understand the standards and to have resources to align teaching with those standards. “And then whatever assessment that we are using aligns to the standards well.”
DPS would comply with whatever measures the state decides upon, but she thinks a test, like PARCC, that is used by multiple other states is valuable for comparative purposes.
Understanding PARCC Results:
In late September, scores were released for the PARCC exams (Partnership for Assessment of Readiness for College and Careers) in English Language Arts (ELA) and Math. The exams assess student proficiency in meeting grade-level standards set by the state. They are aligned to the Common Core national standards. This is the second year for this test in Colorado, allowing measurement of student growth.
Percent Proficient: represents the percentage of students who meet or exceed state proficiency standards in the content area
Growth: is the Median Growth Percentile (MGP). Fifty percent represents one year’s growth. It is calculated by ordering individual student growth percentiles from lowest to highest and identifying a middle score, which is the median. A median score below 50 percent indicates more than half the students have not achieved a year’s growth. A median score above percent indicates more than half the students have achieved a year’s growth.
Scores represent averages of grades 3–5 for elementary and grades 6–8 for middle schools.

0 Comments